

Evaluate models.
Fix what they get wrong.
Every detection and segmentation model you train gets a report of mAP, precision, recall and the images behind each error. Compare models side by side and go from an error straight to the labels that caused it.


Every model you train gets an evaluation report.
The report runs on the validation set when training ends and opens from the Experiments table. Every chart is clickable and leads to the images behind the number.
Object detection
mAP over IoU thresholds from 0.50 to 0.95, AP50, AP75, precision, recall, F1-score, average IoU and a calibration score.
Instance segmentation
The same metrics and charts as for detection, with IoU measured between masks instead of boxes.
Semantic segmentation
Pixel accuracy, IoU and boundary IoU, with the error split into boundary, extent and segment errors.
Also in the report: precision-recall curves, per-class metrics, the confusion matrix, frequently confused classes, the best confidence threshold and an optional speed test in PyTorch, ONNX Runtime or TensorRT. How the metrics are calculated
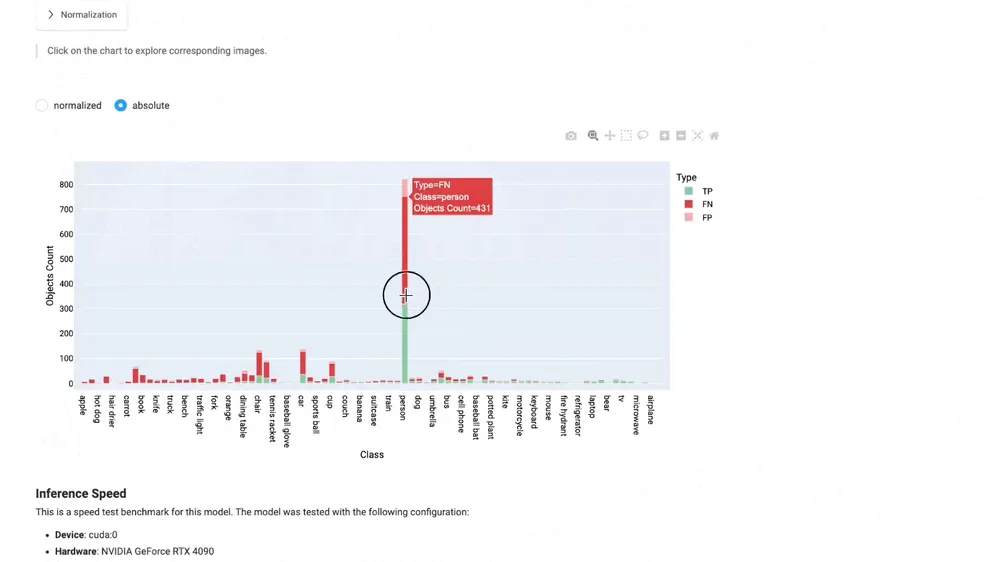
Click any error to see the images behind it.
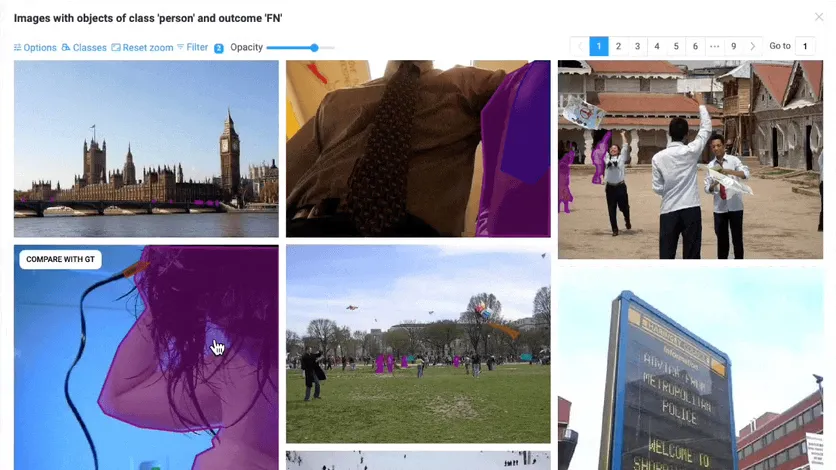
A bar of missed objects or a cell of the confusion matrix opens the exact images, with ground truth and predictions side by side. One more click opens an image in the labeling tool.
Outcome counts by class show what the model finds, misses and invents. The confusion matrix shows which classes it mixes up.
See the images behind a bar or a cell, compare ground truth with predictions, or sort every image by its errors to find the worst cases.
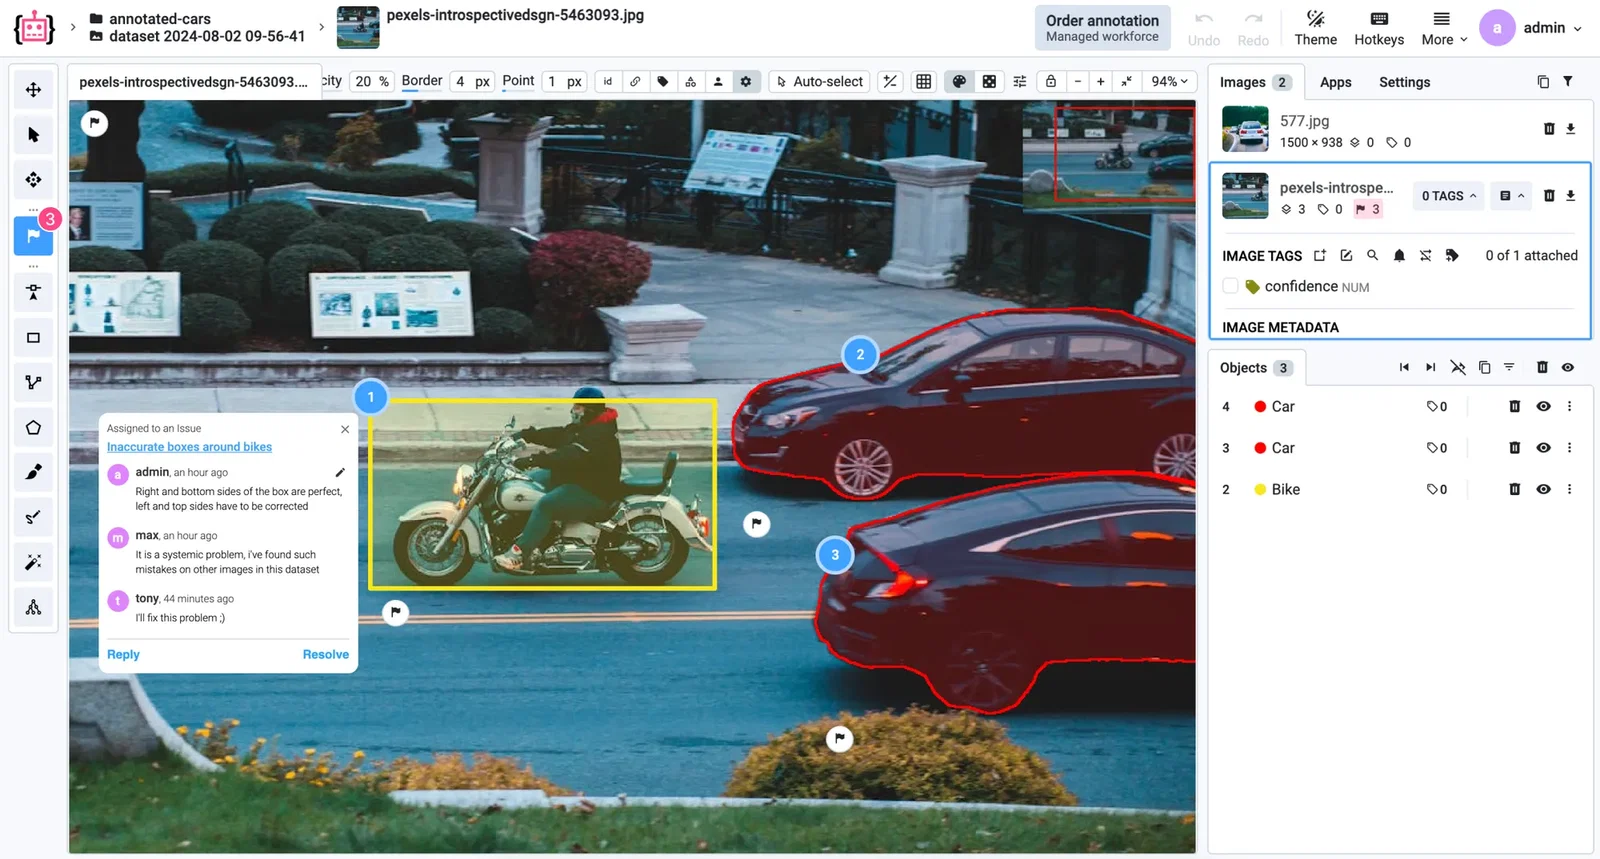
Some errors turn out to be wrong or missing labels. Open the image in the labeling tool from the report and correct it, so the next training run learns from the fix.
Compare models on the same data, including ones you did not train here.
Pick the model to ship from numbers, not impressions: the same validation set, the same metrics, the same charts.
Side by side
Select two or more experiments and get one comparison report with the metrics, curves and predictions of each model.
Any deployed model
Run the same evaluation on a model you serve, on any project with ground truth labels, to check it before it reaches production.
Your own metrics
Extend the benchmark with the metrics of your use case and see them next to every experiment.
Turn what you find into a better model.
Evaluation ends in a set of images to act on. Fix them, label more like them and train again, and the next report shows what changed.
Collect
Save the images behind an error as a collection that labeling queues and training splits can use.
Relabel
Send the collection to a labeling task with review, so fixes are checked before they reach the training set.
Fill the gaps
Find more images of the classes and conditions the model misses, and label them first.
Data curationRetrain and compare
Finetune the model on the improved data from the Experiments table and compare it with the previous one.
Repeated on new data, this is active learning: the model's errors decide what to label next, instead of a random pick.
Here’s why teams trust us.
“A very high product quality.”
BMW Group uses Supervisely to annotate manufacturing images from production lines in their world-wide plants for enhancing quality inspections using deep learning. Supervisely is integrated into the BMW Group AI Platform in order to empower computer vision based AI use cases.
 BMW Group · Manufacturing quality inspection
“Immensely grateful for their pivotal role in our work”
Working with Supervisely has significantly enhanced our capability to develop AI models for lung CT scans. What sets Supervisely apart is its exceptional support team who are really responsive and adapt to our unique needs with a range of apps and helper files.

“Helps us to do data scientist work better and faster”
We use Supervisely since 2019. The key advantage of this tool is that Supervisely provides a complete data treatment pipeline. An important advantage is that a Supervisely instance can be deployed autonomously on a Client infrastructure, and distributed on different servers.

“A valuable part of our computer vision operations”
Supervisely is a valuable part of our computer vision operations, enabling our teams to efficiently work with camera and LiDAR data across sensor fusion projects. We use Supervisely for its extensive feature set and its ability to adapt to our changing requirements.

“Extremely satisfied with Supervisely and would highly recommend it”
The review tools have been invaluable in ensuring the quality and accuracy. The Python SDK has also been incredibly helpful in automating and streamlining our workflow. The support team on Slack has been extremely helpful and responsive.

“Supervisely excels at that and much more”
We’ve been exceedingly impressed with the customer support, addition of new features, and the flexibility of the publicly available SDK/API. The Supervisely team has also been fast to respond to support questions, and has shown a lot of openness when given feedback on potential improvements.

Your team next?
Talk to a computer vision engineer about your data, your models and your infrastructure.
Book a demoFrequently asked questions.
How do I evaluate an object detection model in Supervisely?
Train it in Supervisely: by default, the Model Evaluation Benchmark runs on the validation set when training ends, and the report opens from the Experiments table. For any other model, deploy it and run the Evaluator for Model Benchmark on a project with ground truth labels.
Which metrics does the evaluation report include?
For object detection and instance segmentation: mAP over IoU thresholds from 0.50 to 0.95, AP50, AP75, precision, recall, F1-score, average IoU, classification accuracy and calibration score, with precision-recall curves, a confusion matrix and the F1-optimal confidence threshold. For semantic segmentation: pixel accuracy, precision, recall, F1-score, IoU, boundary IoU and error over union split into boundary, extent and segment errors. See how each metric is calculated.
Can I compare several models on the same dataset?
Yes. Select two or more experiments and the comparison report shows the metrics, curves and predictions of each model side by side. The models need to be evaluated on the same ground truth project.
How do I find mislabeled images in my dataset?
Start from the errors of a model: a confusion matrix cell or a bar of false positives in the evaluation report opens the images behind it, and some of them turn out to be wrong or missing labels. Open them in the labeling tool and fix them. To find more like them, use AI Search and dataset statistics in data curation.
Can I add my own evaluation metrics?
Yes. The SDK has base classes for a custom benchmark: an evaluator, an evaluation result and a visualizer that renders the report. Call it from your training code, and every experiment gets your metrics.