Introducing Video + GPS Telemetry: Synchronize Footage, Maps, and Sensor Data

Review video with synchronized GPS maps and sensor charts in Supervisely, find events by route or telemetry, and label real-world footage for Physical AI.
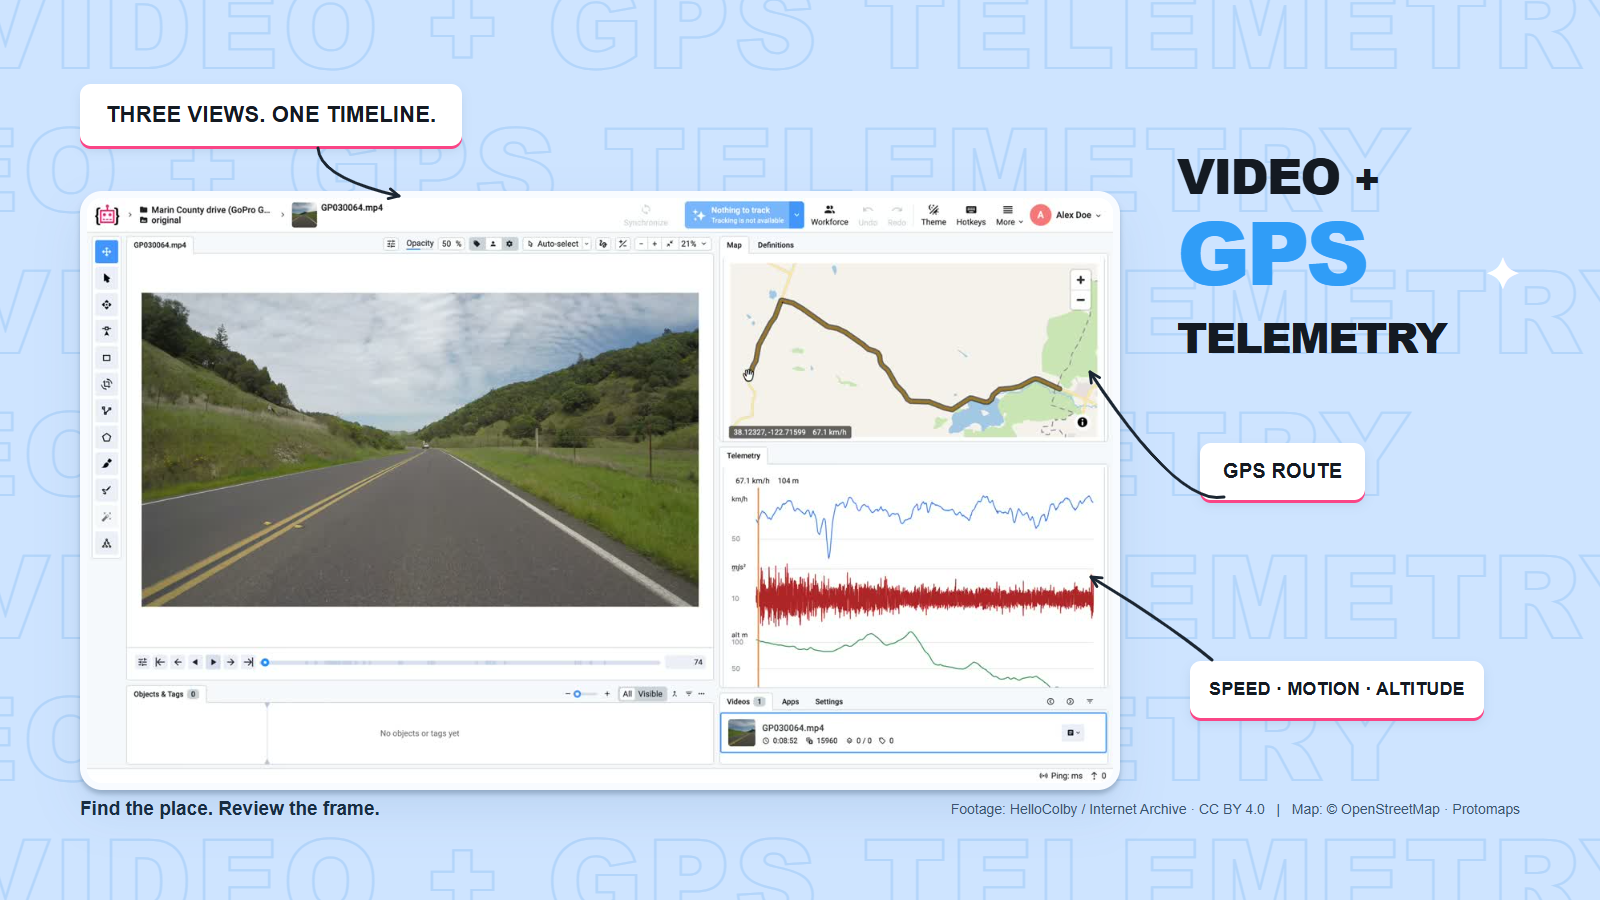
Table of Contents
Finding a particular bend, level crossing or slowdown in a long dashcam or route survey recording can mean watching the same footage several times. A timestamp tells you when a frame was recorded, but not where the camera was or how it was moving.
Video + GPS Telemetry brings the GPS route and sensor readings embedded in compatible recordings into the Supervisely Video Labeling Tool. The video, map and telemetry charts stay synchronized: click a location on the recorded route or a moment on a chart to open the matching frame, review what happened and annotate it. For teams preparing training data for Physical AI, such as autonomous vehicles, robots and drones, this means finding the moments that matter by place and motion rather than scrubbing through hours of footage.
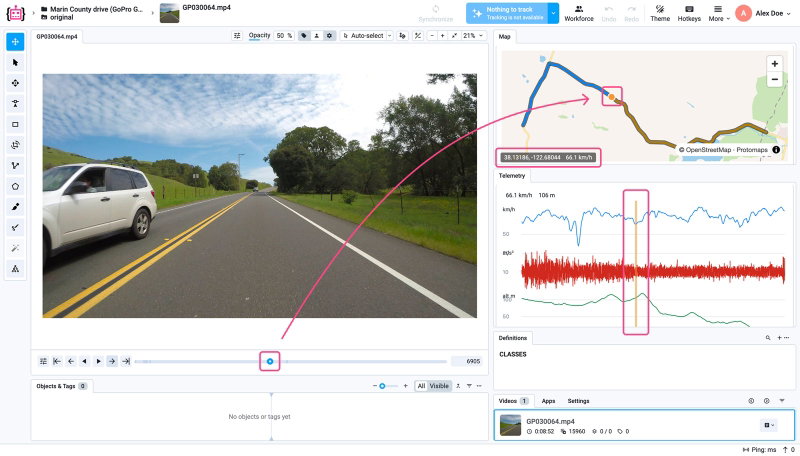 The Telemetry interface: the video, the GPS route with the camera's position, and speed, acceleration and altitude charts on one timeline
Video, map and charts on one timeline
When you open a video in a Telemetry project, two panels appear beside the player:
-
Map shows the recorded GPS route and the camera's position at the current moment. The badge at the bottom shows latitude, longitude and speed in km/h.
-
Telemetry shows three charts along the video timeline: speed in km/h (blue), acceleration in m/s² (red) and altitude in meters (green). An orange playhead marks the current moment.
During playback, the map marker and chart playhead follow the video. Selecting a point on the route or a moment on a chart updates all three views to the same time, so you can compare the scene, location and measurements without aligning them manually.
Start from a place on the route
Sometimes you know where something happened but not when. Click that section of the drawn route in Map, and the video seeks to the moment the camera passed it. The route is colored by playback progress: blue for the part already played, ochre for what is left.
If the vehicle passed the same spot twice, for example at an intersection, a click may land on either pass. Check the video time and the scene, and use the timeline or the charts to pick the one you need.
Find events in the telemetry charts
To find a stop or slowdown, look for a dip on the blue speed chart and click it. The video opens the corresponding frame, and the map shows where the camera was. Review the footage to see whether the vehicle was approaching a bend, following another car or stopping at a junction. The acceleration chart can help you find moments of shaking or sudden movement. Hover over a chart to read its values without moving the video.
The charts help you find moments to review, but do not establish their cause. The acceleration sensor also responds to camera movement and may include gravity, so readings around 10 m/s² should not be interpreted directly as vehicle braking. A drop in speed alone does not prove a hazard, and an acceleration peak alone does not prove a road defect. Review the footage to understand what happened.
Label what you found
Once you find an event, use the Video Labeling Toolbox to annotate it. In the example below, the slowdown is marked with a frame-based slowdown tag. A turn tag marks the bend visible on the map and in the video. The tag ranges may differ: the car can start slowing before it enters the turn.
You can also annotate objects relevant to the event. Here a vehicle box is drawn around the car ahead on two keyframes, and Interpolate until next real frame from the Auto Track quick actions fills in the frames between them.
The tag and class names in these examples were chosen for the demonstration. Use the classes and tags that fit your task.
Keep in mind that speed, acceleration and GPS describe the camera, not the objects in the frame. A vehicle box does not get coordinates or speed of its own, and the exported annotation JSON stores objects, frames and tags but not the telemetry. Keep the original camera file if you need its GPS and motion data later.
Where it helps: real-world data for Physical AI
Physical AI covers models that perceive and act in the physical world: autonomous vehicles and driver-assistance (ADAS) systems, mobile robots, drones, and inspection systems for roads and railways. They learn from footage recorded by cameras moving through real environments, and the events worth labeling, such as a hard stop, a sharp turn or a damaged stretch of road, are rare and spread across hours of recording. Location and motion data help you find them.
-
Road and railway inspection. Go to a section of the route and review road surfaces, signs, level crossings and other objects along it.
-
Dashcam review. Investigate stops, slowdowns and turns by comparing the scene with its location and motion.
-
Route surveys. Use the map to orient yourself and the video to inspect landmarks along the way.
-
Dataset preparation. Find rare events and edge cases by selecting locations on the route or changes in the telemetry charts, then label the corresponding frames and segments for training and evaluating perception models.
What you need
The interface reads telemetry embedded in the video file. Supported sources are original GoPro recordings with a GPMF track and videos with compatible CAMM metadata. A separate GPX, SRT or CSV file is not used as a substitute.
Two things matter when you record and upload:
-
Upload the camera original. Video editors and converters can drop the GPS stream even when the picture looks the same.
-
Wait for a GPS lock before recording. If the camera never got a fix, the video has no route to show, and the interface says so with "This video has no GPS telemetry".
Not every file carries every measurement. GPS, acceleration and altitude are not guaranteed to be present together, so a chart can be missing for a particular camera or recording mode.
How to try it
-
In your workspace, start the project creation wizard.
-
Choose Videos as the project type and Telemetry as the labeling interface.
-
Upload your original recordings to a dataset and open a video. The Map and Telemetry panels appear once the telemetry has loaded.
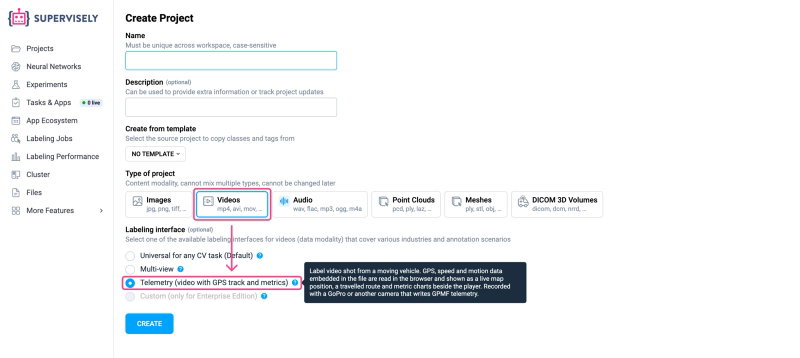 Create a Videos project and select the Telemetry labeling interface
For an existing video project, open Settings, select Telemetry under Project labeling interface and save.
Telemetry is a labeling interface of the Supervisely platform. On Enterprise installations it has to be enabled in the license, so ask your administrator if you do not see it when creating a project. If you create projects from Python, use Supervisely SDK 6.74.39 or later: it knows the telemetry interface.
To try the recording shown in this post, download the original GoPro file GP030064.MP4 (about 4 GB) and upload it to a Telemetry project. Choose the file with the uppercase .MP4 extension; the smaller transcoded copy is not the camera original.
The full guide covers chart reading, partial GPS coverage, export and troubleshooting: Video + GPS Telemetry in the Supervisely docs. Questions or a large fleet of recordings to label? Contact us.
Footage: “Driving in Marin County, CA Countryside” by HelloColby, Internet Archive, CC BY 4.0, shown in screenshots and recordings of the Supervisely interface; explanatory annotations added.
Supervisely for Computer Vision
Supervisely is online and on-premise platform that helps researchers and companies to build computer vision solutions. We cover the entire development pipeline: from data labeling of images, videos and 3D to model training.
The big difference from other products is that Supervisely is built like an OS with countless Supervisely Apps — interactive web-tools running in your browser, yet powered by Python. This allows to integrate all those awesome open-source machine learning tools and neural networks, enhance them with user interface and let everyone run them with a single click.
You can order a demo or try it yourself for free on our Community Edition — no credit card needed!
Liked this blog post? Share it!




Subscribe to new blog posts
Table of Contents
🤖 Try Supervisely: it's free!
Full stack platform with hundreds of Apps ready to solve any computer vision task: from labeling to model training. Create account
 ★★★★★ Rated 4.7 of 5


